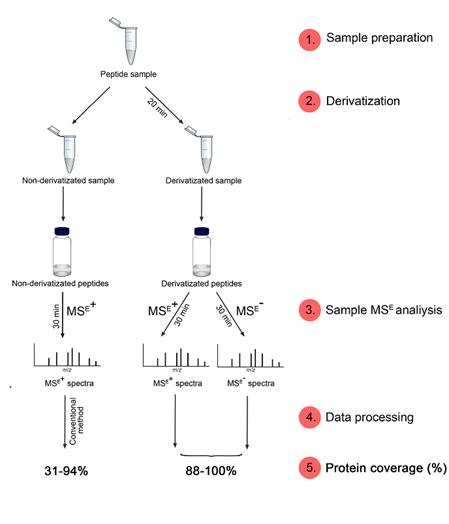
Figure 1. Schematic representation of the methods workflow.
dr. sc. Mario Cindrić
mag. sci Marija Nišavić
dr. sc. Amela Hozić
RUĐER BOŠKOVIĆ INSTITUTE, ZAGREB, CROATIA

Currently used LC/MS (MS) technique for protein identification is based on database matching of non-derivatized peptide signals recorded in the positive ion mode. Although widely used, such an approach does not always provide satisfactory sequence coverage to unambiguously identify a protein sample.
We have introduced a peptide derivatization method that allows for spectra recording in both - positive and negative ion mode, in order to increase peptide sequence coverage. This method for unambiguous protein identification could be utilized in wide variety of industrial and research applications.
What we are presenting is:
The method comprises of four main steps (Figure 1):
Figure 1. Schematic representation of the methods workflow.
Post-column addition of reagent A enables negative ionization of derivatized and non-derivatized peptides. Examples of UPLC chromatograms with and without post-column introduction of reagent A (0.4 µL flow rate) are shown in Figures 2 and 3.

Figure 2. UPLC chromatogram of derivatized BSA digest negative ion mode without post-column addition of reagent A.

Figure 3. UPLC chromatogram of derivatized BSA digest with post-column addition of reagent A.
In order to compare sequence coverage obtained using our method with the conventional one, 12 protein samples: bovine serum albumin (BSA), transferrin (Trn), erythropoietin (Epo), lysozyme (Lyz), aldolase (Als), ß-casein (Csn), Isoleucyl-tRNA syntetase (IleRS), nucleotidyl transferase (CCA), TEV protease (TEV), Leucyl-tRNA synthetase (LeuRS), Elongation factor Tu (EF-Tu) and Seryl-tRNA synthetase (SerRS) were analyzed. In case of Epo and Trn, glycan moieties were enzymatically removed with PNGase F prior to trypsin digestion using protocol described by Cindrić et al1.
Is given in APPENDIX under section Sample preparation
1. LC
LC system: nanoACQUITY UPLC® (Waters, Milford, MA, USA)
Trapping column: nanoACQUITY UPLC® 2G-V/M Symmetry® C18 Trap
Column, 100Å, 5μm, 180 μm x 20 mm (Waters, Milford, MA, USA,
p/n 186006527)
Trapping conditions: Isocratic delivery of aqueous 0.1% formic
acid, at 15 μL/min for two minutes
Analytical column: ACQUITY UPLC® BEH130 C18, 130 Å, 1.7 μm, 100
μm × 100 mm Column (Waters, Milford, MA, USA, p/n: 186003546)
Column temperature: 40 °C
Elution flow rate: 1 µL/min
Mobile phase A: aqueous 0.1% formic acid
Mobile phase B: 0.1% formic acid in 95% acetonitrile
Gradient: 0.1% to 99% solvent B in 30 minutes
Run time: 30 minutes
Sample injection volume: 4 µL
2. MS
Instrument: SYNAPT G2-Si mass spectrometer (Waters, Milford, MA, USA)
MSE data were acquired in positive ion mode for non-derivatized samples and positive and negative ion modes for derivatized samples with collision cell energy alternating between low energy (4 eV) to collect peptide precursor (MS) data, and elevated energy (ramping from 20 to 40 eV) to obtain peptide fragmentation (MSE) data (standard MSE procedure). Sampling of the lock spray channel (1 ng/μL leucine enkephalin in 50:50 isopropyl alcohol/water containing 0.1% formic acid) was performed every 1 min to ensure high mass accuracy.
The acquired data were processed by ProteinLynx Global Server software (PLGS; v. 3.0.1, Waters). Peak lists were generated after deisotoping and deconvolution. Separate databases containing sequence of each of the investigated protein were created and the data were searched with trypsin as a digestion reagent and three potential miscleavages. Peptide and fragment tolerance were set to automatic. Oxidation M and dehydratation ST were allowed as variable modifications in all protein data sets, while deamidation N was added for Epo and Trn data and phosphorylation for Csn data set.
For the derivatized peptides, N-term reagent modifier was created for 5-formylbenzene-1,3-disulfonic acid and used as fixed modification in workflow parameters.
By comparing the percentage of protein sequence coverage obtained using conventional method (non-derivatized + mode) with the percentage obtained using our method (derivatized +/- mode), we have found that our method provided higher sequence coverage for each of 12 analyzed proteins. The results are shown in Figure 4 and summarized in Table 1 . More detailed information about coverage of the analyzed proteins can be found in separate document (Appendix_2015-05-19).
 |
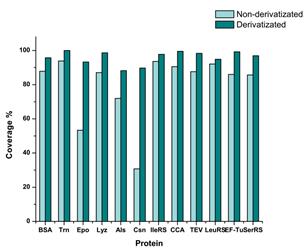 |
Figure 4. Protein sequence coverage (%) calculated after PLGS data processing and database matching of non-derivatizated and derivatizated peptides acquired in MSE analyses in positive and positive/ negative ion mode, respectively.
Our method provided sequence coverage that ranged from 88-100% (96% on average), in contrast to conventional method that ranged from 31-94% (80% on average). Derivatization method provided 16% higher sequence coverage, with the best result obtained for Csn sample where the difference in sequence coverage reached 59%.
Table 1. Protein sequence coverage (%) calculated after database matching of non-derivatizated and derivatizated peptides acquired in MSE analyses in positive and positive/ negative ion modes, respectively.
|
Protein: |
BSA |
Trn |
Epo |
Lyz |
Als |
Csn |
IleRS |
CCA |
TEV |
LeuRS |
EF-Tu |
SerRS |
|
Non-derivatized (+ mode) % |
87.81 |
93.84 |
53.37 |
87.07 |
71.98 |
30.80 |
93.60 |
90.53 |
87.60 |
92.09 |
86.04 |
85.63 |
|
Derivatized (+/- mode) % |
95.72 |
100 |
93.26 |
98.64 |
88.19 |
89.73 |
97.76 |
99.51 |
98.35 |
94.88 |
99.24 |
96.93 |
Sample preparation